I realised it’s been a while since I played with anything new technically, and since observability is currently one of the hot topics in the IT industry it seemed only fitting to investigate sending and displaying metrics.
Time is short & precious, so rather than setting something dedicated up, I used what I already had available and running, my Home Assistant Raspberry Pi.
I installed both InfluxDB (to send the metrics too) and Grafana (to display the metrics from InfluxDB) from the HA add-ons. This was painless and once configured to start, I had both programs running.
The next step was to create a new database within influxDB to store my metrics from HA, I also created a new user with full access to the newly created DB and the _internal

The next thing to do was add the influxDB connection and measurement settings to Home Assistant in order for metrics to be sent and stored in the database. This was a case of editing the configuration.yaml file like so:
influxdb:
  ### Connection Setting ###
  api_version: 1
  ssl: false
  username: '<secret>'
  password: '<secret>'
  host: localhost
  port: 8086
  database: homeassistant

  ### measurements setup ###
  tags:
    source: ha
  tags_attributes:
    - friendly_name
  default_measurement: units
  exclude:
    entities:
      - zone.home
    domains:
      - persistent_notification
      - person
  include:
    domains:
      - sensor
      - binary_sensor
      - sun
    entities:
      - weather.home
The eagle eyed will see that I used API version 1, this was due to the fact that I couldn’t see the option to create an API token in the installed version of influxDB required for API version 2. Instead of messing around I opted for the easy version 1 option.
Once this was done and the config re-read, I could see measurements appearing in the influxDB via a query.

After that I wanted to visualise the data in Grafana, and that’s where the fun started. Despite being able to create a successful data connection to influxDB using the supplied credentials, however it kept telling me that 0 measurements were available. Clearly this was a lie as I could see that influxDB had measurement data from the previous query.
After a bit of messing around and stumbling across this community post I managed to resolve by removing the original user, and recreating, after this Grafana could see the measurements stored in influxDB.
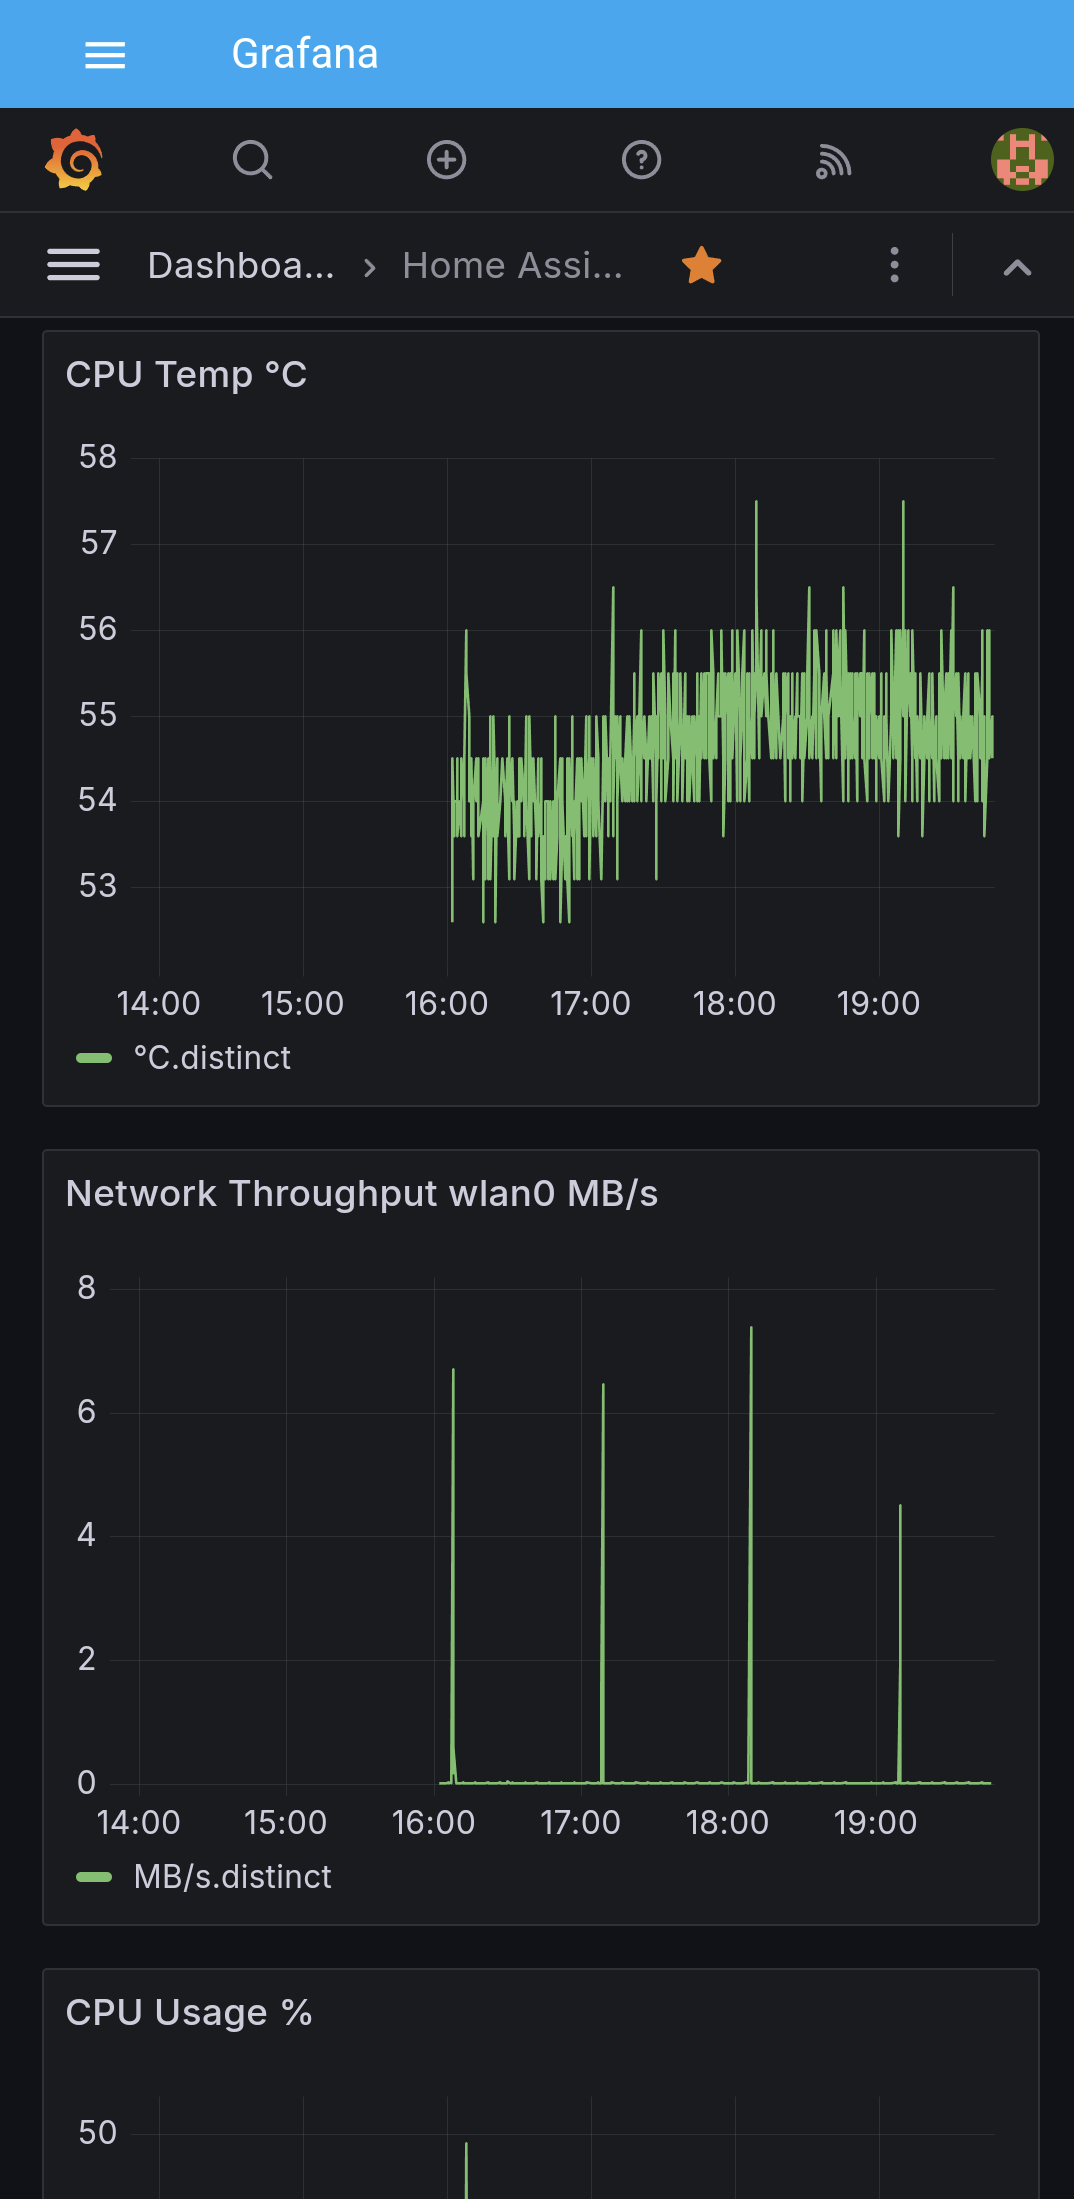
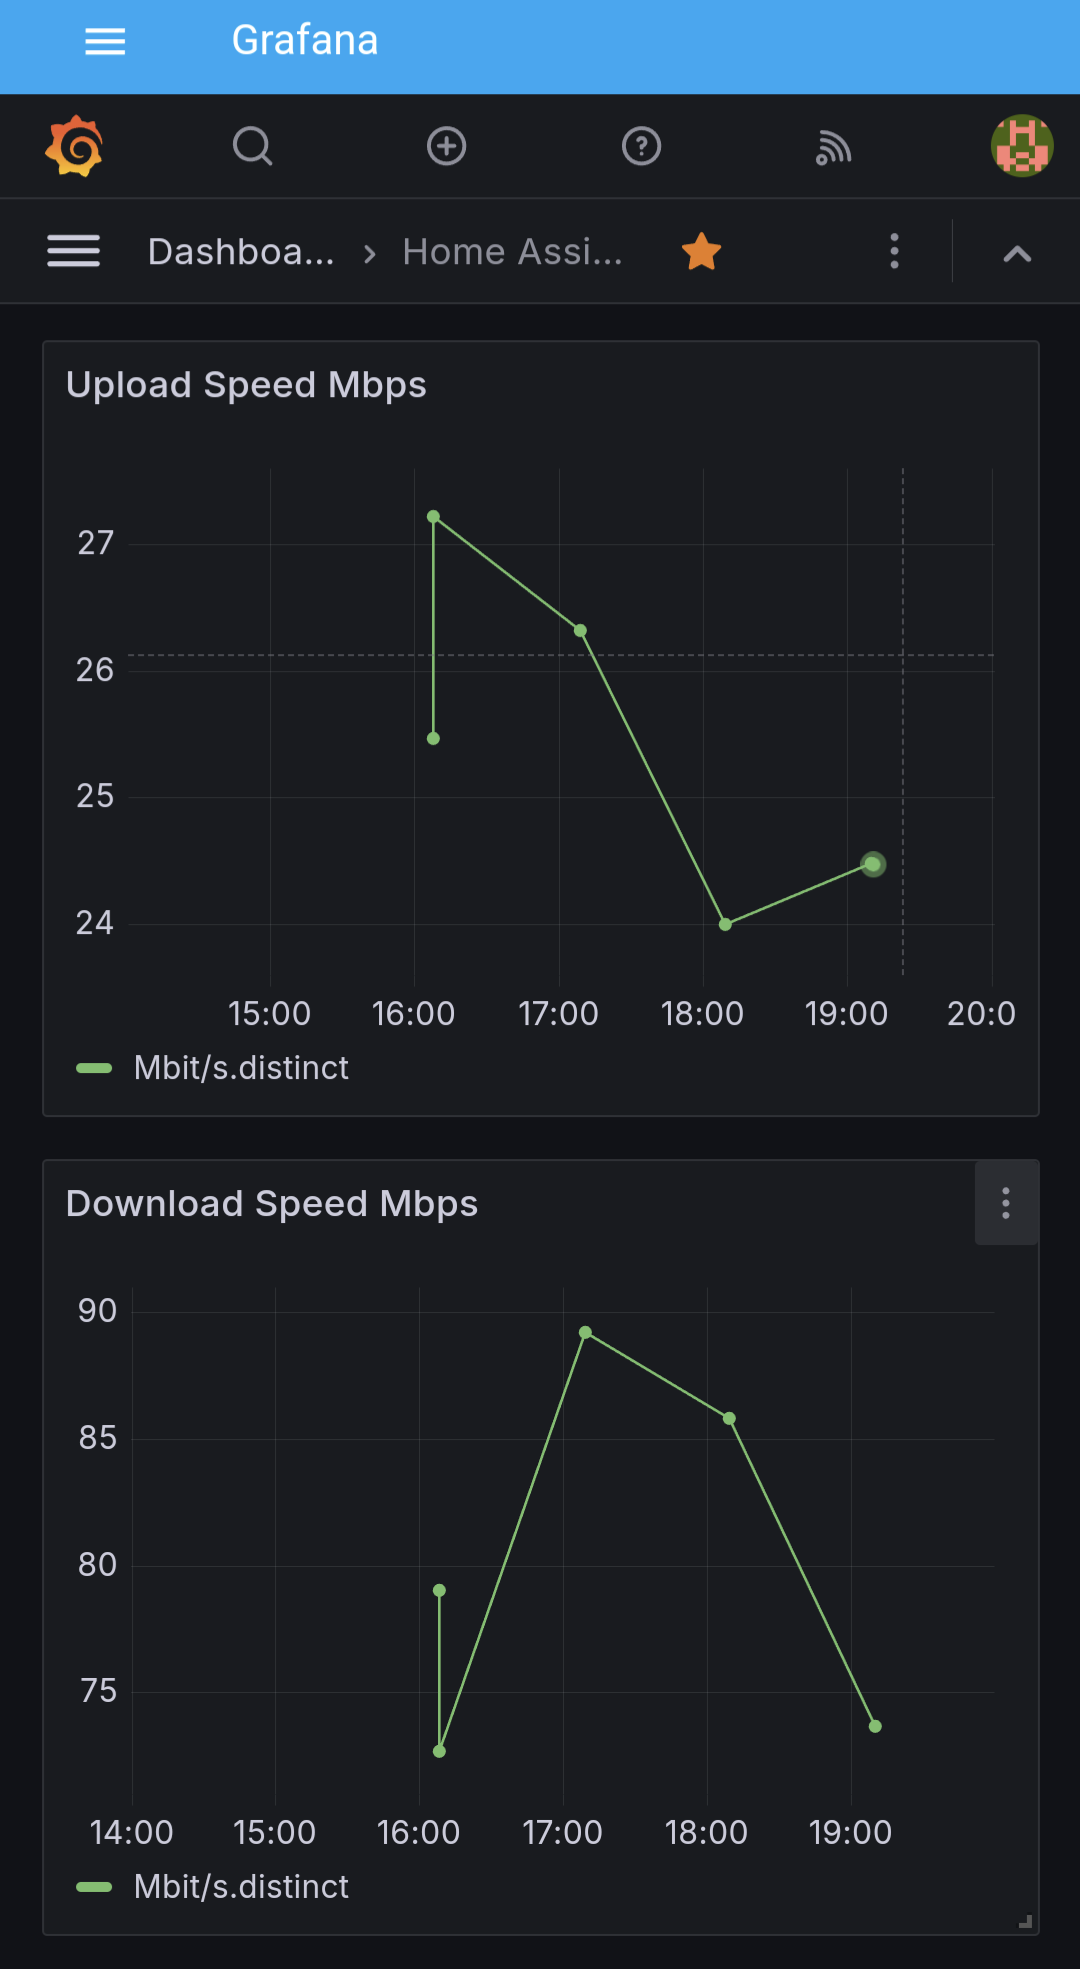
From here it was pretty straightforward to create some graphs on dashboards (remembering to hit save once completed!)
Obviously this is only scratching the surface of what can be done, with the ability to create rules and actions within influxDB which looks interesting. Some people may be reading this and thinking, “why”, “you can just create a dashboard with graphs in Home Assistant”. Of course that’s true, but for a future project when I have more time I would like to send metrics from other devices on my home network, including the RPi hosting this blog post, using an Open Telemetry agent.